Reviewed paper: Gama Sosa MA, Gasperi RD, Rocher AB, Wang AC, Janssen WG, Flores T, Perez GM, Schmeidler J, Dickstein DL, Hof PR, Elder GA. (2009) Age-Related Vascular Pathology in Transgenic Mice Expressing Presenilin 1-Associated Familial Alzheimer’s Disease Mutations, Am J Pathol. 2010 Jan;176(1):353-68. doi: 10.2353/ajpath.2010.090482. Epub 2009 Dec 11.
This study addresses age-related, vascular pathology in the brains of mice transfected with a mutated human gene implicated in Familial Alzheimer Disease (FAD), called presenilin 1 (PS1). Changes in morphometry in the vessels begin when the mice are approximately one year of age. Vessels in cortical and subcortical regions become noticeably thinner and irregular; described as string-like, and some become kinked and twisted. Unbiased stereology was used to perform quantitative analysis of the length and area of the microvessels in the hippocampus and to determine the volume of the hippocampus. The total vascular length was about 45% shorter in the hippocampi of the mice expressing PS1.
FAD largely mimics the much more common sporadic disease except for an earlier onset. Regarding the sporadic disease, neurofibrillary tangles, and neuron and synapse loss are present in the brain, but there are also vascular abnormalities. This vascular pathology is mainly characterized by congophilic amyloid angiopathy (CAA), a deposition of amyloid in the vessel wall. Arteries and arterioles that perfuse the arachnoid and pia mater and neocortex are most affected. Problems with the sporadic disease also include a decreased density and fragmentation of the microvasculature, and micro-vessels that appear less branched, string-like, and sometimes kinked and looped. Regarding the inherited disease, three gene mutations in humans have been found to underlie FAD: amyloid precursor protein (APP), presenilin 1 (PS1), and presenilin 2 (PS2). CAA occurs when the APP mutation or the PS1 and PS2 mutations together are present, but no CAA has been observed with just PS1. The authors wanted to know, if and what kind of vascular pathology is present in the hippocampus of mice with the PS1 mutation, and also examine causal relationships between any such vascular pathology and AD by asking what comes first.
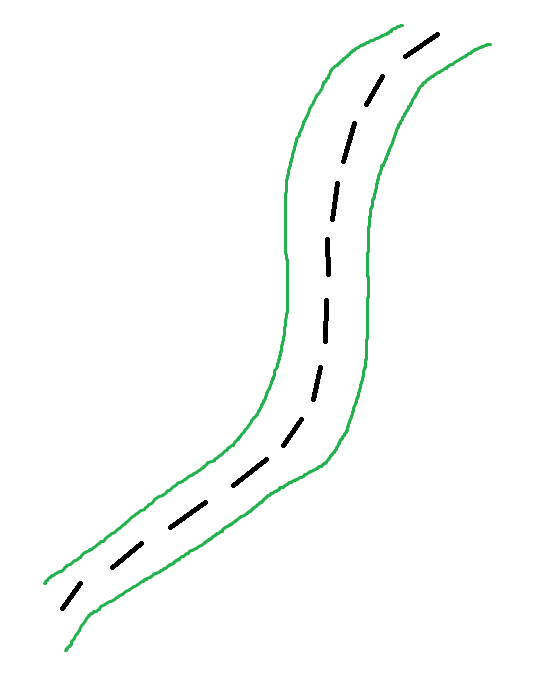
Stereo Investigator® was used in this study to perform unbiased stereology to quantify the length and area of blood vessels in, and the volume of, the hippocampus. The Stereo Investigator® software was configured to control a Zeiss microscope outfitted with a motorized XY stage, Z-encoder and camera. The Spaceballs method (a probe with isotropic virtual spheres) was used to quantify length. The procedure for Spaceballs is described in the manuscript (Gama Sousa et al., Stereologic Analysis, p. 6). This probe uses a shape that is isotropic (a sphere) to obviate the need of proving that the vessels are isotropic or of making the specimens isotropic by vertical or isotropic sectioning. Using Spaceballs, spheres are superimposed on the specimens. Therefore, thick sections must be used. The brains were sectioned at 50 microns; and underwent shrinkage due to the histological processing to a mean of 18.3 microns, this left enough section thickness for the Spaceballs probe. The study used a section interval of six; i.e., every sixth section was sampled. A random starting section was chosen for each animal. The vessels were visualized using collagen IV-immunostaining that stains the basement membranes of the blood vessels. The Hippocampal borders were outlined using a 2.5x objective lens. Since the hippocampus is such a distinctly identifiable structure there was no need to describe how the borders were delineated. For anatomical regions that are less distinct, it would be helpful to describe the criteria used to delineate the borders to help others reproduce the experiment. A 40x objective lens was used to focus through the tissue and mark all of the intersections of the centers of the vessels with the probe. The black dotted line in the middle of the green vessel depicted below shows what is meant by center of the vessel; it is the long-axis of the vessel and in practice is easily imagined.
 Hemispheres with a radius of 15 microns were used instead of full spheres. Using hemispheres rather than full spheres is appropriate for the thickness of the sections. The dimensions of the sampling grid (the distance between hemispheres) and the size of the guard zones was well described. The number of intersections were reported, mean = 335, and since a significant difference was found between groups, sufficient sampling was done to achieve statistical significance. The formula given on page six for vessel volume length density is:
VLD = {[2 X ∑ is X (Dx X Dy X t)] / [2 X π X r2]} X (1 / V)
VLD = length per volume (volume length density)
is = intersections of long-axis of vessel with hemisphere (red stars in figure below)
Dx = distance between hemispheres along x axis
Dy = distance between hemispheres along y axis
t = post-artifact-shrinkage section thickness
r = radius of the hemisphere
V= ‘investigated tissue volume’ (the volume of the hippocampus considering only every sixth section)
This formula is in a different form than the original Spaceballs paper (Mouton et al., equation 2, p. 55):
L = 2 · ∑Q- · [v / a] · F1 · F2 · F 3
L = length
Q- = intersections of middle of vessel with hemisphere (red stars in figure below)
v = volume of the smallest cube that fits around the sphere
a = surface area of the sphere or hemisphere, depending on what is used
F1 = section-sub-fraction
F2 = area-sub-fraction
F3 = height (or thickness)-sub-fraction

In comparing the formulas: (black circles are spaceball spheres and green lines are vessel segments, both contained in a tissue section) In the original Spaceballs paper (top) the formula uses the smallest cube that can be placed around the sphere or hemisphere (red cube). In the Gama Sousa paper we are considering (bottom) the formula instead is designed for a 3D rectangle that fits around the grid-step and the section thickness (red 3D rectangle: Dx X Dy X t).
| Original | Gama Sosa | |
| 2 | 2 | |
| intersections of middle of vessel with hemisphere | Q· | is |
| 3-D rectangle that fits around grid-step and section thickness | (Dx X Dy X t) | |
| volume of the smallest cube that fits around the sphere | v | |
| surface area of a hemisphere | a | (2 X π X r2) |
| volume of hippocampus but for every sixth section | V | |
| section-sub-fraction | F1 | |
| area-sub-fraction | F2 | |
| thickness-sub-fraction | F3 |
Since the volume used in the formula is smaller in the original paper (see red boxes), more terms are needed. In other words, the area-sub-fraction and the thickness sub-fraction are not needed for the formula in the form that Gama Sousa uses it, since the volume of the (red) box takes those into consideration; it extends further in the ‘t’ direction to account for the thickness-sub-fraction and extends farther in the ‘Dx’ direction to account for the area-sub-fraction. The only discrepancy left is the lack of a section-sub-fraction in the Gama Sousa formula. This can be explained by the fact that V is not for the whole hippocampus but for every sixth section (referred to as the “investigated tissue volume” in the text under the formula on page 6 of Gama Sousa, et al.); the section-sub-fraction is contained in the term ‘V’.
When estimating length using unbiased stereology, the length estimated is the post-histological-processing length, i.e. the ‘shrunken’ length. There is no valid way to fully compensate and calculate the in vivo length because of the difficulty in applying shrinkage correction in three dimensions when it’s not known what percentage of the vessels are extending through which of the three planes. Although the authors state that “stereology software corrected for this”, it is the post-processing length as affected by artefactual shrinkage that is quantified.
The authors are exemplary in reporting the quantification of the length of vessels in and the volume of the hippocampi. They do not solely report the density, therefore it is possible to determine if it is the length and/or the volume that is changing. The length is smaller and the volume is smaller in the hippocampi of PS1 animal; subsequently the density changes less than 20%.
This is an important paper with an exciting conclusion that has implications for understanding Alzheimer Disease. The unbiased stereology used to quantify length of blood vessels is well-founded and well-described; both rigorous and reproducible. Tracing all of the blood vessels for each group would be prohibitively time consuming; so unbiased stereology was used instead. The authors speculate that since PS1 is only expressed in neurons, it may be that abnormalities begin in the neurons and then either due to some detrimental product coming from the neurons or a lack of a needed signal, the vasculature becomes deformed. They also suggest that it may be the degeneration of neurons that largely contributes to the loss of volume in the hippocampus.